
System Creation and Management
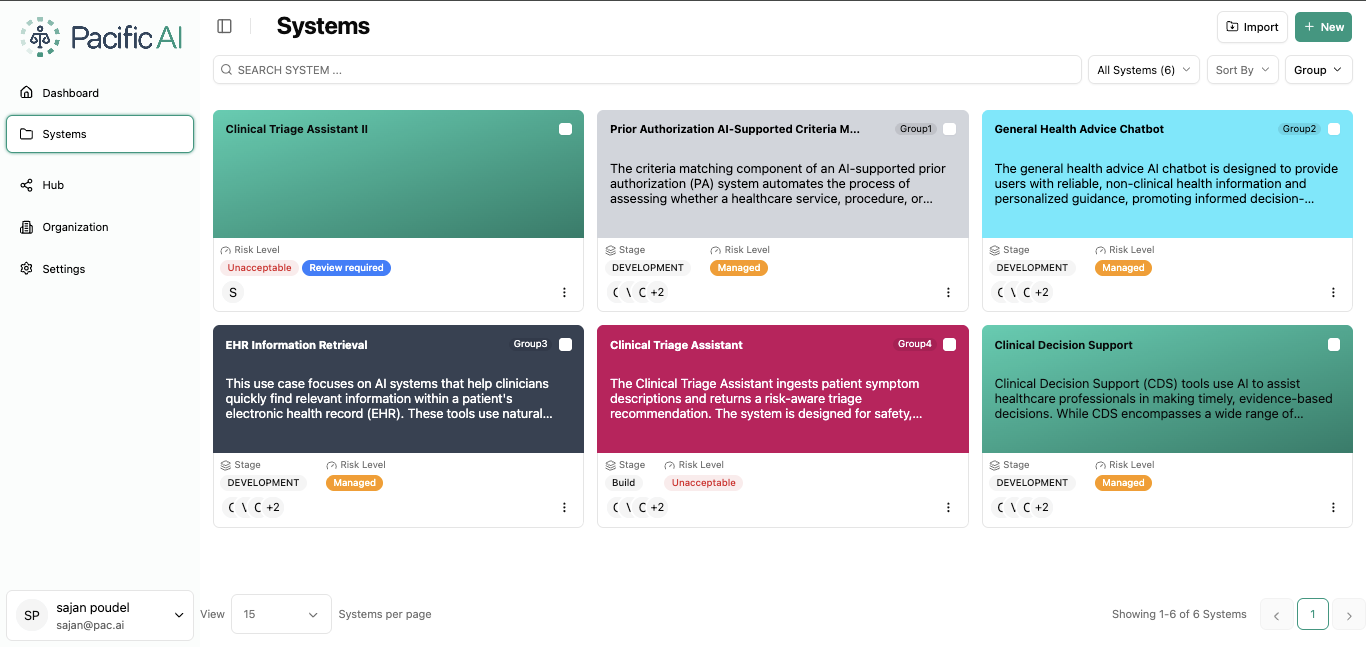
The Systems Dashboard provides a centralized view of all AI systems within Pacific AI. It serves as the primary entry point for accessing, managing, and monitoring systems across the organization.
The dashboard displays a list of systems along with key attributes such as:
- System Name
- Description
- Lifecycle Stage
- Risk Level
- Group (Determined based on the color of the system card)
- Team Members
Users can quickly scan and access systems based on this information.
System-Based Navigation
Section titled “System-Based Navigation”Pacific AI organizes system-related functionality into three functional areas:
- Governor – Governance, documentation, and risk management
- Gatekeeper – Model evaluation and benchmarking
- Guardian – Continuous monitoring and alerting
Before Selecting a System
Section titled “Before Selecting a System”When users first log in, no system is active. The left navigation panel displays the three functional areas under System:
- Governor
- Gatekeeper
- Guardian
Until a system is selected, no child pages are displayed beneath these sections. Instead, a prompt is shown asking the user to Select a System.
This ensures that all system-related activities are performed within the context of a specific system.
After Selecting a System
Section titled “After Selecting a System”Once a system is selected from the Systems Dashboard, it becomes the Active System. The name of the selected system is displayed in the navigation panel, and the available pages are grouped under the Governor, Gatekeeper, and Guardian sections.
The underlying functionality of Pacific AI remains unchanged. The navigation structure organizes existing features into logical functional areas.
Governor
Section titled “Governor”The Governor section contains governance, documentation, and risk management capabilities for the selected system.
The following pages are available:
Summary
Section titled “Summary”View and manage general information about the selected system, including System Name, System Descripion, Version and Keywords.
System Risk
Section titled “System Risk”Access and manage risk assessments, architecture analysis, impact assessments, risk registries, and compliance reviews.
Model Card
Section titled “Model Card”Generate, create, review, edit, and download Model Cards that document the system’s intended use, performance characteristics, limitations, and evaluation results based on the uploaded System Documents.
Documents
Section titled “Documents”Upload, organize, search, and manage system documentation, including architecture, quality assurance, operational, and regulatory documents.
Vendors
Section titled “Vendors”View vendors associated with the active system. This page provides the same vendor information available through the Organization section but automatically filters the results to display only vendors associated with the selected system.
Manage users assigned to the active system and define their system-level roles and responsibilities.
Gatekeeper
Section titled “Gatekeeper”The Gatekeeper section contains model evaluation and benchmarking capabilities.
Test Suite
Section titled “Test Suite”Create, configure, and execute Test Suites for the selected system.
Test Suites can be used to evaluate model performance across supported benchmark categories, including safety, fairness, reliability, and other evaluation dimensions.
Leaderboard
Section titled “Leaderboard”View and compare the latest evaluation results across Test Suites.
The Leaderboard provides a consolidated view of evaluation scores and allows side-by-side comparison of performance metrics.
Guardian
Section titled “Guardian”The Guardian section provides monitoring and alerting capabilities for deployed AI systems.
Monitoring and Alerts
Section titled “Monitoring and Alerts”The Monitoring and Alerts page displays all Test Suites that have been configured as scheduled monitoring jobs for the active system.Selecting a monitoring job displays detailed information in the right-hand pane. The available tabs include:
-
Monitoring Results: Displays the latest monitoring outcomes and evaluation metrics collected from scheduled executions.
-
Configuration: Allows users to configure monitoring schedules and notification settings. Configuration options include:
- Execution frequency
- Start and end dates
- Alert thresholds
- Notification settings
- Throttle factor
These settings determine how often monitoring jobs are executed and when alerts are generated.
-
Run History: Provides a history of monitoring executions, including execution dates, status, and results. This information can be used to review past monitoring activity and identify performance trends.
-
Alerts: Displays alerts generated by monitoring jobs. Users can review alert details, investigate recurring issues, and track conditions requiring attention.
Active System Context
Section titled “Active System Context”All pages displayed under Governor, Gatekeeper, and Guardian operate within the context of the currently selected system.
To switch to another system, return to the Systems Dashboard and select a different system card. The navigation structure and displayed information will automatically update to reflect the newly selected system.
Filtering and Sorting
Section titled “Filtering and Sorting”To help manage multiple systems efficiently, the dashboard supports:
- Search by Name – Locate systems quickly
- Sorting Options – Sort systems by:
- Date
- Name
- Stage
- Risk Level
- Group
- Ownership Filters:
- View systems owned by the user
- View systems shared with the user
These options allow users to organize and find systems based on their responsibilities and needs.
Role-Based Access
Section titled “Role-Based Access”Access to systems is controlled based on user roles:
Governance Officer
Section titled “Governance Officer”- Can view all systems across the organization
Risk Manager
Section titled “Risk Manager”- Can create new systems
- Can view and manage systems they own or are assigned to
Compliance Officer and Developer
Section titled “Compliance Officer and Developer”- Can view systems they are assigned to
- Access is limited to their role-specific permissions within those systems
The Systems Dashboard ensures that users have visibility into relevant systems while maintaining controlled access based on roles and responsibilities.
System Management
Section titled “System Management”Create New System
Section titled “Create New System”Only a user with Risk Manager role can create a new system. A user can create a system by clicking on the + New button on top right of the Systems Dashboard.
Each system in Pacific AI must include:
- A unique name
- A short description
- A system version
- Relevant keywords or tags
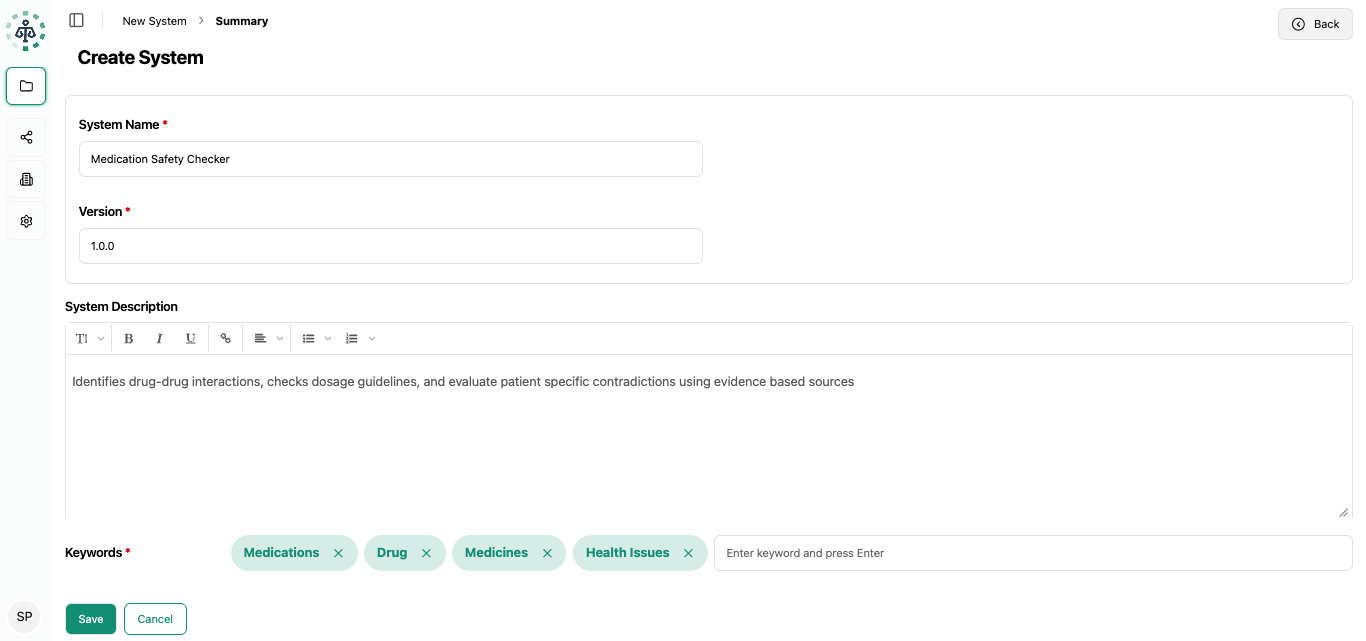
This information ensures traceability, searchability, and version control across the platform.
Clone an Existing System
Section titled “Clone an Existing System”Create a duplicate of an existing system using the Clone option available in the system’s kebab menu.
- The cloned system retains configuration and metadata
- A “clone” suffix is automatically added to differentiate it from the original
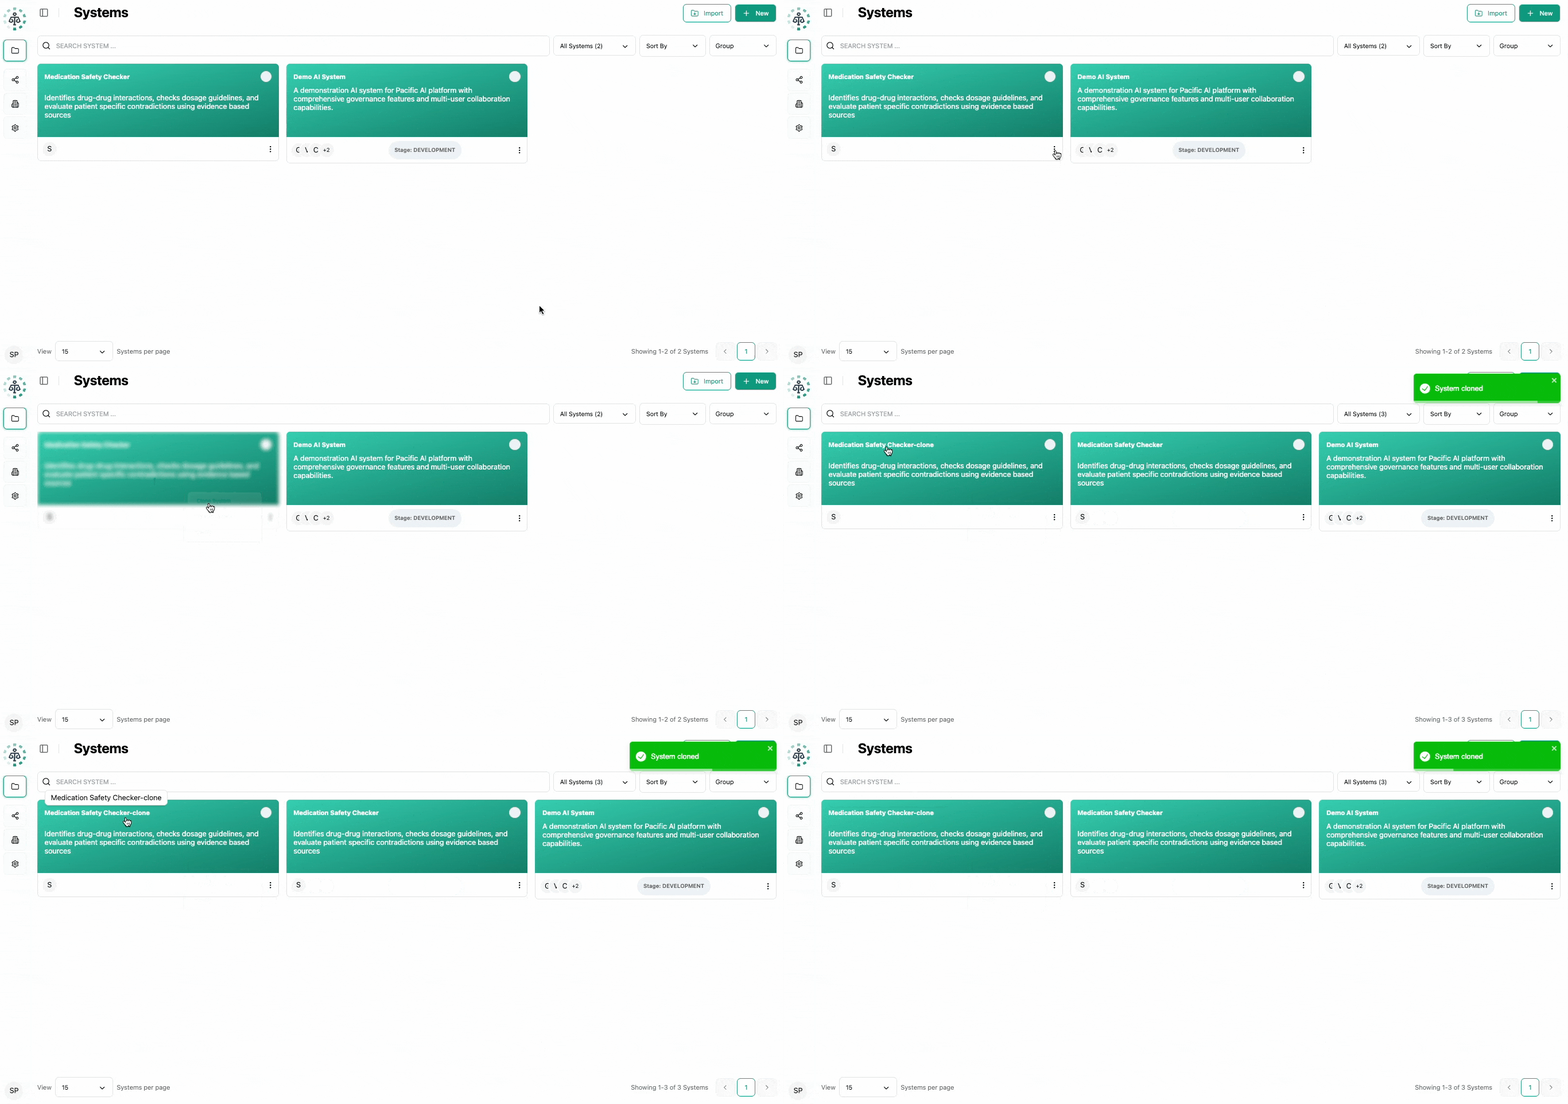
Cloning is useful for testing changes, creating new versions, or reusing configurations.
Export an Existing System
Section titled “Export an Existing System”Export a system from the kebab menu. Click on the three dot menue at the bottom right corner of the System Card to open the menue and select Export System.
- The export generates a ZIP archive
- All system data, configuration, and associated documents are included
Import a System
Section titled “Import a System”Import a previously exported system by uploading the ZIP archive. Import any systems by clicking on the Import button, located on the top right corner of the Systems Page.
- All original configurations, metadata, and documents are restored
- The imported system is created as a new copy within the platform
System Grouping
Section titled “System Grouping”To improve organization, systems can be grouped.
- Assign one or more systems to a group
- Assign a color to each group for visual identification
- Systems can be moved between groups at any time
- Filter the system list by group name
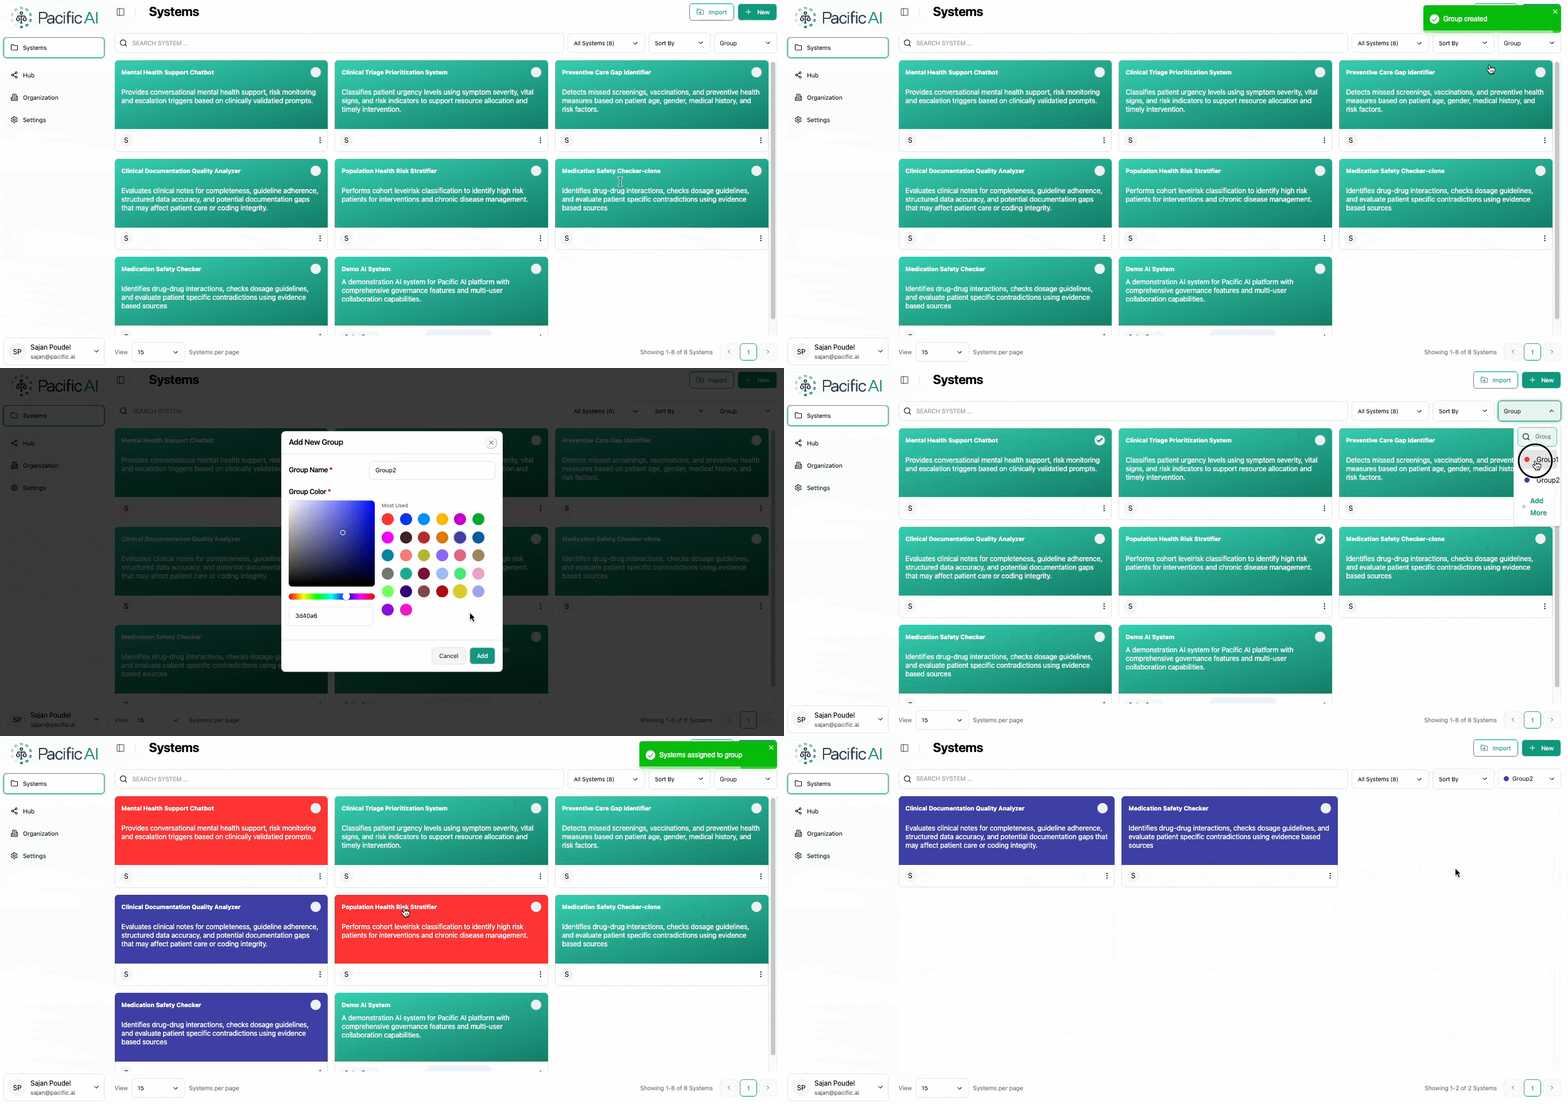
Grouping helps manage large numbers of systems efficiently.