
Leaderboard
The Leaderboard provides a consolidated view of benchmark results and allows users to compare stored evaluation results across model versions, competing models, and different Pacific AI systems.
Comparisons are performed using existing Test Suite results, so models do not need to be re-executed. This allows users to evaluate and compare model performance using previously completed benchmark runs.
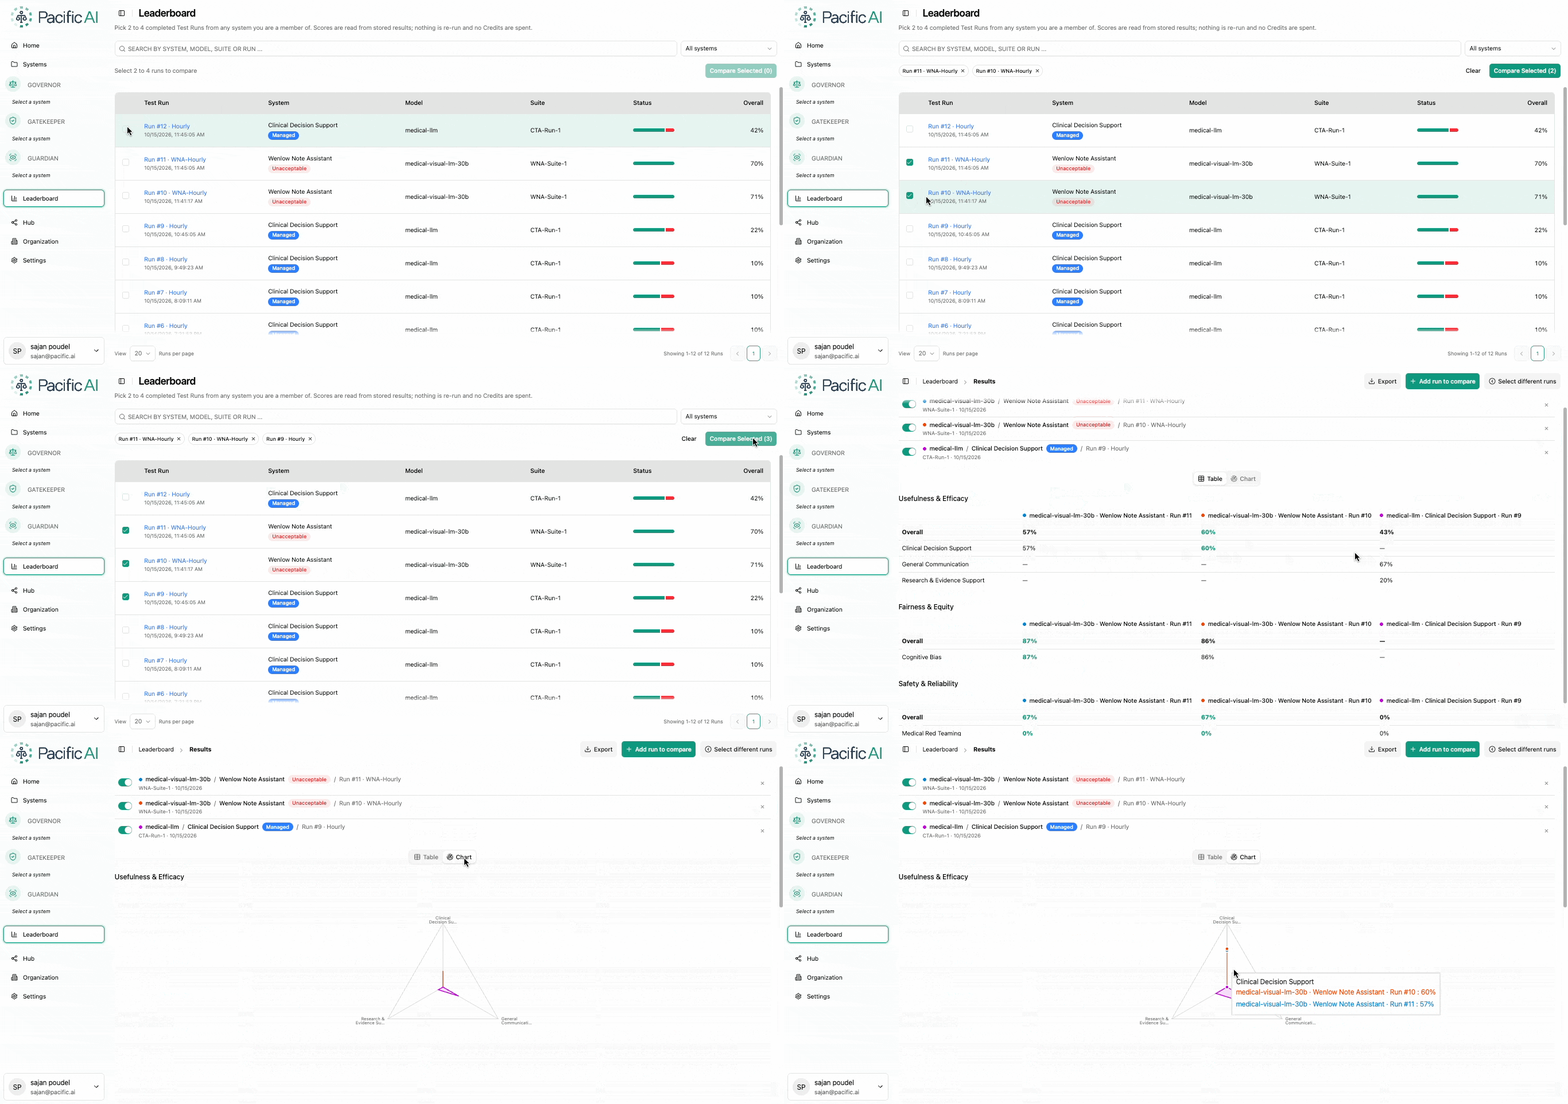
Users can compare up to four test runs at a time. The selected test runs can belong to different model versions, models, or Pacific AI systems, provided the user has permission to access those results.
View Benchmark Results
Section titled “View Benchmark Results”The Leaderboard displays available benchmark results for models evaluated within Pacific AI. Users can review scores across test categories and subcategories and identify differences in model performance.
Each result identifies its source information and evaluation results, including:
- Test Run along with date and time
- System
- Model
- Test Suite
- Benchmark score
Only test runs that the current user is authorized to access are displayed and available for comparison.
Select Test Runs for Comparison
Section titled “Select Test Runs for Comparison”Users can select test runs for comparison using the checkbox associated with each result.
To compare test runs:
- Select the test runs using the checkboxes.
- Select up to four test runs.
- Click Compare Selected.
- The selected results are displayed in the comparison view.
The Leaderboard supports comparison of test runs from different Pacific AI systems. This allows users to compare models even when their benchmark evaluations were performed independently within separate systems.For example, users can compare:
- Different versions of the same model evaluated in different systems.
- Competing models evaluated in different systems.
- Different models and versions using the same Test Suite.
- Stored benchmark results from multiple systems.
The comparison uses the results already stored in Pacific AI and does not require the models to be available for re-execution.
Comparison View
Section titled “Comparison View”The comparison view presents the selected test runs side-by-side so users can evaluate their benchmark performance.
Each result remains identifiable by its source information, including the model, model version, Pacific AI system, Test Suite, and Test run.
Common metrics across the selected test runs are presented together, allowing users to compare corresponding scores and identify differences in performance.
Table View
Section titled “Table View”The Table view presents benchmark scores and metrics side-by-side for the selected test runs.
Users can use the table to review individual metrics and compare the performance of different model versions, competing models, or models evaluated in different systems.
Chart View
Section titled “Chart View”The Chart view provides a visual representation of the benchmark results for the selected test runs.
Charts make it easier to identify differences in scores across common metrics and compare the overall evaluation performance of the selected models.
Export Comparison Results
Section titled “Export Comparison Results”Users can export the selected comparison results for further analysis, reporting, or use in external tools.
Comparison results can be exported in the following formats:
- JSON
- CSV
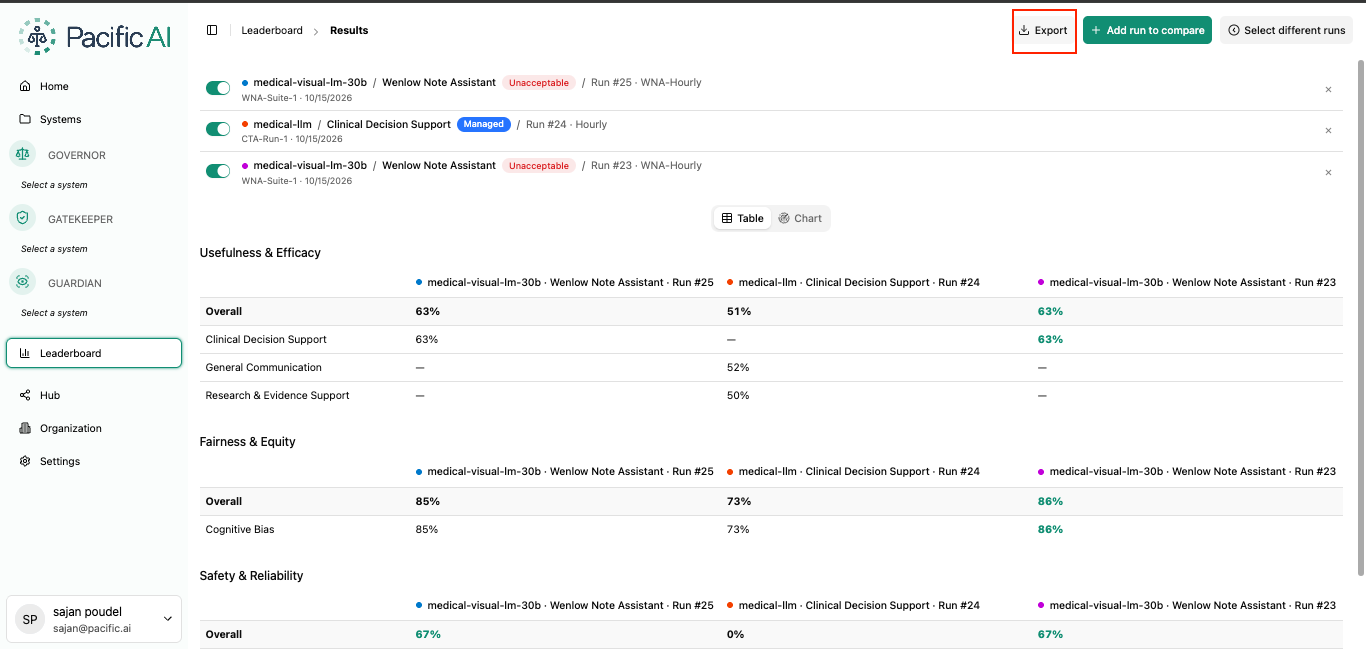
The exported data contains the benchmark results and source information for the selected test runs.
Access and Permissions
Section titled “Access and Permissions”The Leaderboard respects the user’s existing system and role-based permissions.
Only test runs that the user has permission to access are available for viewing and comparison. Users cannot use the Leaderboard to view or compare benchmark results from systems or test runs outside their authorized access.